

Turn Data Into Insight.
Make Better Decisions.
We help businesses and institutions make sense of their data, understand performance and identify opportunities for improvement. From Excel analysis and automated reporting to interactive Power BI dashboards and management scorecards, we turn scattered information into clear, actionable insight.
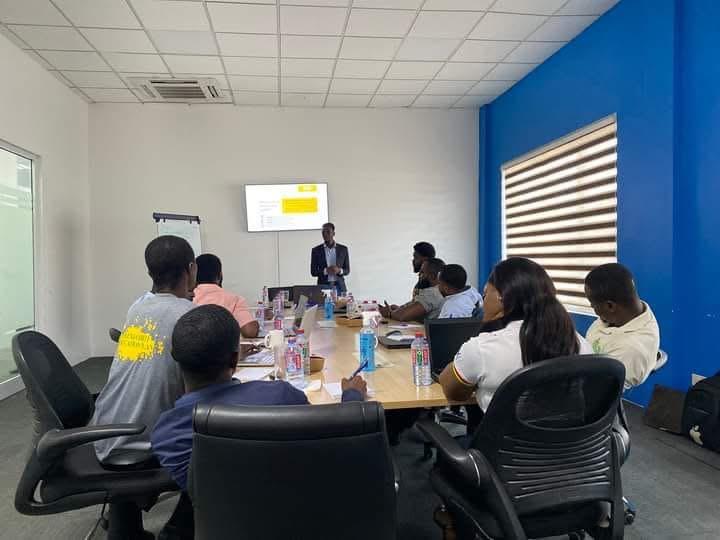
Understand What Your Data Is Telling You
Organisations generate data through sales, finance, customer service, operations, projects, learning activities and everyday transactions. When that information is spread across spreadsheets and disconnected systems, it can be difficult to see what is working and where action is needed.
Yellolab Solutions helps you organise, analyse and present data in ways that support planning, performance monitoring and informed decisions. We start with the questions your organisation needs to answer, then work with your available data to develop appropriate reports and analytical tools.
Our solutions can use Excel, SQL databases, Power BI and Python where appropriate. We also consider data quality, access controls, documentation and staff capability so that insights can be trusted and used consistently.
Talk to us about your data and reporting needsData Analysis
Explore trends, patterns, variances and performance indicators in your data.
Dashboards & Visualisation
Present important measures through clear charts, scorecards and interactive dashboards.
Data Preparation
Improve consistency, structure and usability before analysis and reporting.
Decision Support
Connect analysis to organisational goals, risks, opportunities and action plans.
Practical Analytics for Better Business Decisions
We help you move from disconnected data and manual reporting to reliable information that supports action.
Excel Analysis & Reporting
Develop structured spreadsheets, formulas, PivotTables, data validation and repeatable reports to improve everyday analysis and reduce manual effort.
Power BI Dashboards
Build interactive dashboards, visual reports and management scorecards that help teams monitor KPIs, compare results and explore performance.
Data Cleaning & Preparation
Identify duplicates, missing values, inconsistent formats and other quality issues, then prepare datasets for dependable reporting and analysis.
Database Queries & Data Integration
Use SQL and suitable data tools to retrieve, combine and structure information from available sources for analysis and reporting.
KPI & Performance Scorecards
Define meaningful performance indicators and create reports for management, departments, projects and service delivery teams.
Advanced Analytics with Python
Apply appropriate Python-based analysis to larger datasets, recurring data tasks, statistical questions and exploratory analysis where useful.
Financial & Operational Analysis
Analyse budgets, costs, sales, inventory, service levels and operational results to help identify variances, trends and areas for improvement.
Business Intelligence Consulting
Identify reporting gaps, define business questions, select suitable metrics and plan a practical BI solution aligned with organisational objectives.
Analytics Training & Coaching
Build staff capability in Excel, data interpretation, Power BI, reporting practices and responsible use of organisational data.
Make Decisions with Greater Clarity and Confidence
Good analytics helps organisations ask better questions, recognise emerging issues and focus attention on the measures that matter. We make reports useful to the people who need to act on them.
Gain Visibility into Performance
Bring important measures together so managers can understand results across teams, services and reporting periods.
Reduce Manual Reporting
Improve recurring reporting workflows and reduce avoidable copying, reconciliation and spreadsheet preparation.
Identify Trends and Exceptions
Highlight unusual results, performance gaps, changing demand and areas that may require further investigation.
Align Data with Business Goals
Connect reports and KPIs to objectives, service standards, budgets and management decisions.
Promote Trustworthy Data Use
Consider data quality, access permissions, confidentiality, documentation and appropriate handling throughout the analytics process.
Analytics for Businesses and Institutions
We tailor reports, dashboards and analytical methods to each organisation's goals, data maturity and operating environment.
Businesses & SMEs
Understand sales, customers, costs, stock, profitability and day-to-day business performance.
Financial Services
Support management reporting, operational monitoring and appropriate analysis of financial and service data.
Schools & Institutions
Analyse enrolment, attendance, assessment, resources and administrative performance.
NGOs & Development Projects
Support programme monitoring, project indicators, activity reporting and evidence-informed planning.
From Business Questions to Actionable Insight
A clear process helps ensure that analytics is relevant, understandable and practical to maintain.
Understand the Questions
Agree on the decisions, business challenges, users and key performance measures the analysis must support.
Review the Data
Identify available sources, assess data quality and confirm access, definitions and reporting requirements.
Analyse & Visualise
Prepare the data and develop appropriate analysis, reports, dashboards or scorecards.
Explain & Improve
Walk through the findings, support interpretation, train users and refine the solution as needs evolve.
Ready to Get More Value from Your Data?
Tell us about your reporting challenges, available data and the decisions you want to improve. We can help you identify a practical next step.